An Effective Guide to Data Mining, Data Structures & Data Manipulation
Data mining can assist in the discovery of gold in a mine of data. Data mining is the process of sifting through enormous data sets for useful information.

When we think about mining, we think of it as a labor-intensive, time-consuming, and fruitless activity — after all, hacking away at rock walls for hours on end in the hopes of finding gold sounds like a lot of effort for a minimal reward.
Data mining, on the other hand, is just the opposite: you can reap rewarding results without putting much work at all, thanks to sophisticated tools that do it for us. The software can filter through gigabytes of data in minutes, providing useful insights into the data’s patterns, journeys, and relationships.
So, let us look at what data mining is, how we do it, as well as data structures and data manipulation in brief.
Introduction to data mining
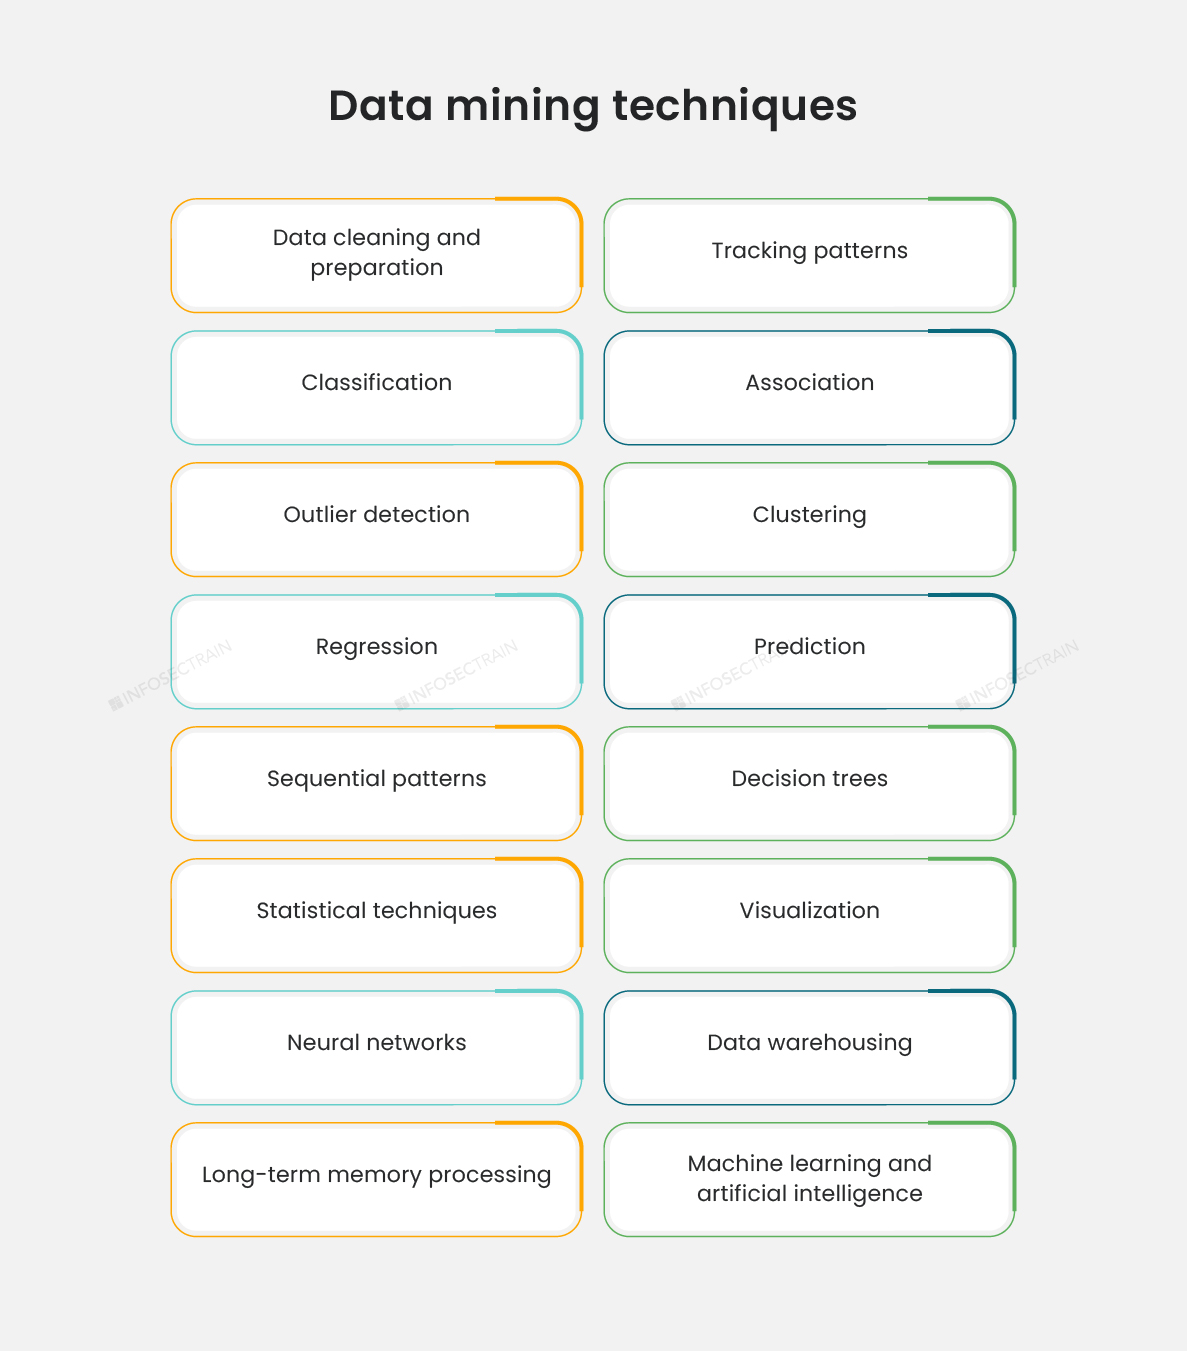
Data mining refers to an analytical process that identifies significant trends and relationships in raw data to forecast future data. Data mining tools sift through enormous amounts of data using a variety of ways to find data structures, including anomalies, patterns, journeys, and correlations. Data mining, as we know and utilize it today, has been around since the early 1900s and consists of three disciplines:
- Statistics: The study of data relationships numerically.
- Artificial intelligence: Software or machines that exhibit high human-like intelligence.
- Machine learning: Learning the ability to learn from data automatically and with minimum human intervention
These three elements have aided us in moving away from the time-consuming processes of the past and towards simpler and more effective automation for today’s complex data sets. In fact, the more complex and varied the data sets are, the more relevant and accurate their insights and predictions will be.
Data mining yields insights by revealing structures within data, which businesses may utilize to foresee and solve problems, plan for the future, make informed decisions, mitigate risks, and capture new growth possibilities.
What are the steps in data mining?
There are six steps in the data mining process in general.
- Outlining your business goals: It is critical to have a solid understanding of your business objectives. This will allow you to establish the most precise project parameters, such as the time frame and scope of data, the primary goal of the project, and the criteria for determining its success.
- Understanding your data sources: With a greater grasp of your project requirements, you will be able to determine which platforms and databases are required to solve the problem, whether it is from your CRM or excel spreadsheets. You will also be able to determine which sources provide the most relevant data.
- Preparing your data: The ETL process, which stands for Extract, Transform, and Load, will be used in this step. This prepares the data by ensuring that it is collected from a variety of sources, cleaned, and then collated.
- Analyzing the data: At this point, the organized data is sent into a sophisticated application. Various machine learning algorithms go to work to identify relationships and patterns that might aid in decision-making and forecasting future trends. This application organizes and standardizes the relationships between data elements, commonly known as data points. For example, a data model for a shoe product may include elements such as color, size, purchasing method, purchase location, and buyer personality type.
- Reviewing the results: You will be able to see if and how successfully the model’s predictions, answers, and insights can help you confirm your forecasts, answer your questions, and achieve your business goals.
- Deployment: After completing the data mining project, the results should be made available to decision-makers in the form of a report. They can then decide how they want to use that knowledge to meet their business goals. In other words, this is where the results of your analysis are put into practice.
Data mining might backfire if you do not adequately manage and prepare your data, resulting in inaccurate insights and forecasts. However, when done effectively and with the appropriate software, data mining allows you to sift through chaotic data noise to identify what is important and then use that information to make informed decisions.


Data Structures
The data structure is used to store data in an ordered manner to make data manipulation and other data operations more efficient.
Types of data structures:
- Vector: Vector is a homogeneous data structure and one of the most basic data structures. In other words, it only contains components of the same data type. Numeric, integer, character, complex, and logical data types are possible.
- Array: They are data structures with multiple dimensions. Data is kept in an array in the form of matrices, rows, and columns. The matrix elements can be accessed using the matrix level, row index, and column index.
- Matrix: The matrix is a two-dimensional data structure with a homogeneous structure. This signifies that only items of the same data type are accepted. When elements of various data types are transmitted, coercion occurs.
- Series: It is only available in Python, especially when using the Pandas package. It is a one-dimensional labeled array that can hold any type of data (integer, string, float, Python objects, etc.). The axis labels are referred to as the ‘index’.
- Data frame: A data frame is a two-dimensional array with a table-like appearance. Each row includes one set of values from each column, and each column contains one set of values. A data frame can contain numeric, factor, or character data, and the number of data items in each column should be the same.
- Table: It simply tabulates categorical variables’ results. In R, it is frequently used for aesthetic purposes.
- List: Lists can contain elements of various sorts, such as numbers, texts, vectors, and another list. A matrix or a function can be one of the members of a list, and it is an ordered and mutable collection.
- Factor: In statistical modeling, factors are employed in data analysis. They are used to record levels and categorize categorical data in columns, such as “TRUE,” “FALSE,” and so on. They can store both strings and integers, and factors are an R-only feature.
- Dictionary: It is also known as a hash map, and it accepts arbitrary keys and values. Numbers, numeric vectors, strings, and string vectors can all be used as keys. It is a changeable, indexed, and unordered database.
- Tuple: Python is the only language that has it, and it is made up of organized and unchangeable elements. A tuple can contain numerous items, which can be of various types (integer, float, list, string, etc.).
Data Manipulation
The process of manipulating or changing data to make it more organized and legible is known as data manipulation. To accomplish this, we employ Data Manipulation Language (DML), a computer language capable of adding, removing, and updating databases. DML allows us to clean and map data in order to make it consumable for expression.
Data science with InfosecTrain
Going deeper into data science can open up new job prospects. Enroll in InfosecTrain’s data science training course to leverage the benefits of world-class training. This exclusive data science course will teach fundamental and advanced topics like data mining and data manipulation. You will also learn about data structures and algorithms for Machine Learning while learning about AI’s essential principles and concepts as well as programming languages like Python and R.


 1800-843-7890 (India)